Everyone always asks me, when will I get myself a properly calibrated Integrating Sphere (IS) for lumen measures? The short answer is when someone pays for one for me. 
But the real question is, can the relative output values of my home-made milk carton lightbox be converted to lumen estimates? First off, a few points about my lightbox.
I generally modeled my lightbox design on Quickbeam's (aka Doug Pribis) flashlightreviews.com site. Sadly, this excellent resource is no longer active (and the domain has been taken over by someone who has pirated Doug's original treasure-trove and added other unconfirmed and pirated material :shakehead). But at least the background info still seems to be there, untouched.
My lightbox differs in one important way - I've reversed the light and sensor placement, to facilitate runtimes. In my case, the flashlight enters the flat bottom of the milk carton, and the sensor is located on the side of the carton near the base. The bezel of the flashlight thus serves as its own baffle, preventing any light from shining directly on the sensor.
As Doug noted, this is hardly a perfect integrating sphere. But it doesn't have to be – as long as you realize the results are simply relative output values, you can still draw meaningful comparisons between lights. But can you convert my milk-carton output values to estimated lumens by some sort of conversion factor?
To begin to answer that question, you would need calibrated IS data for the lights tested in the lightbox. Well, if I had a calibrated IS, I would be using it. But there are a number of other people – and manufacturers – who do have them. Although not as good as actually testing my specific samples in their ISs, can we tell something meaningful from lights we have in common?
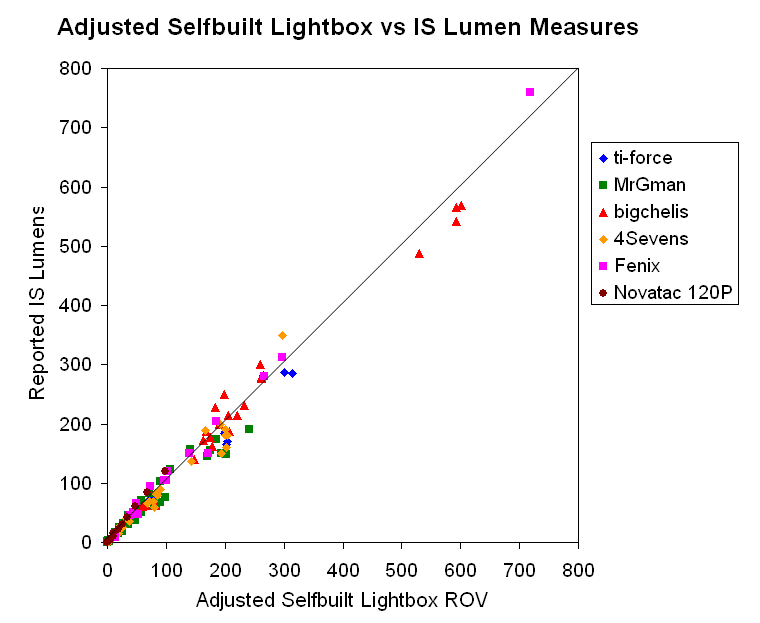
Below is a graph showing how lights in my lightbox correlate to the reported IS values by three members here (MrGman, ti-force, and bigchelis) and three manufacturers (Fenix, 4Sevens and Novatac). Each data point represents one output mode of a given light we have in common. I have matched the reported batteries and time post-activation for the lights in question (if multiple time points were available, I picked the last one we both had in common). There are about 150 unique data points in the total set, representing over 40 lights.
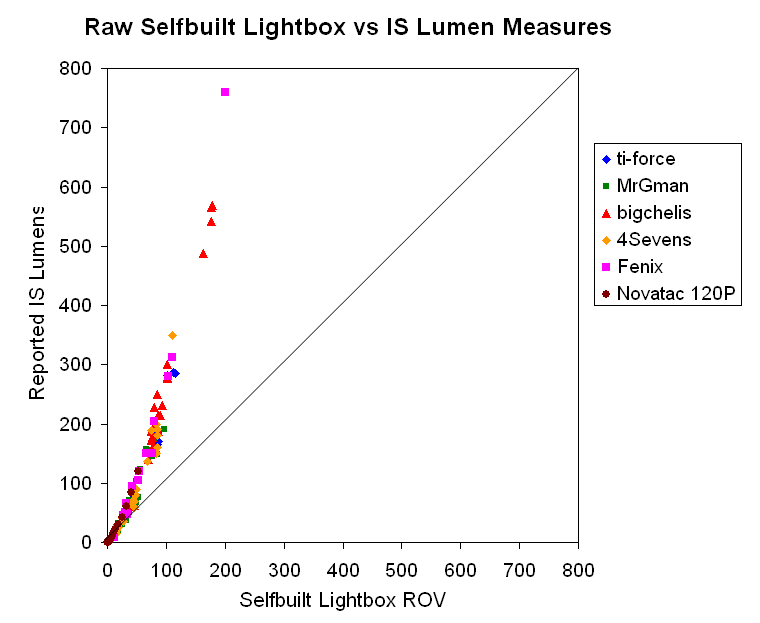
If my lightbox were a calibrated IS, you would expect to see a perfect linear relationship as shown by the diagonal line. Obviously, it isn't.
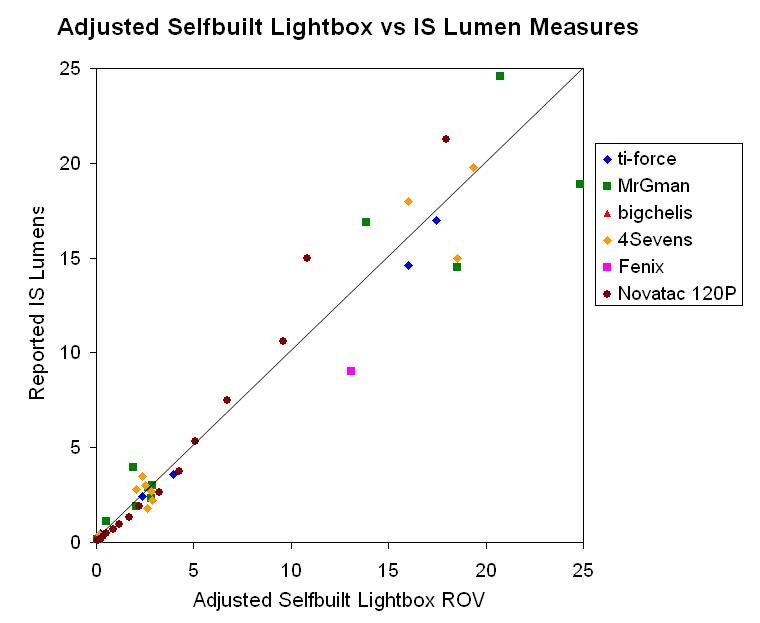
But the relationship does look somewhat linear, just not 1:1. Is it? Let's improve the scale ranges and see:
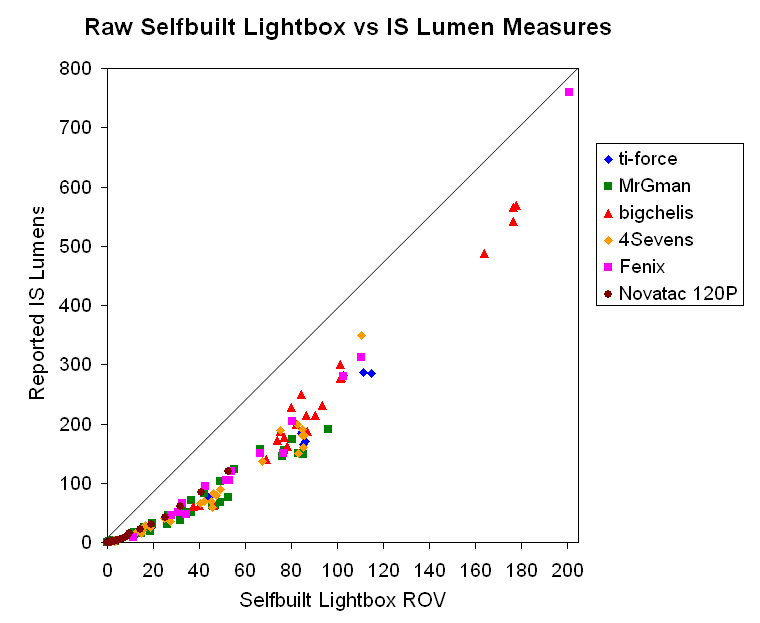
Ok, clearly there is not a simple linear relationship of my lightbox to any of the IS results (although it isn't that far off, either). Still, this means that you cannot simply multiply my readings by a specific number to get a really good lumen estimate (i.e. the classic "y = mx + b" linear relationship with a slope and y-intercept wouldn't hold here).
But even though the relationship between my box and the reported IS values is not linear, it is most certainly not random. Rather, it is consistently curvilinear. In fact, to my eye, it looks like a simple power relationship (i.e. y = a * x^b).
Before the modern age of computers, it was certainly a complex problem to try and fit non-linear data. But nowadays, you can do all sorts of comparison modeling of non-linear systems with statistical validation.
I've spent some time running analyzes of this data set, and I can't quite get one good power relationship that fits the whole range of 0.1 to 800 lumens perfectly. However, I have found two power fits that work well – one for < 20 on my lightbox relative output scale, and one for > 25. Here is how they look:
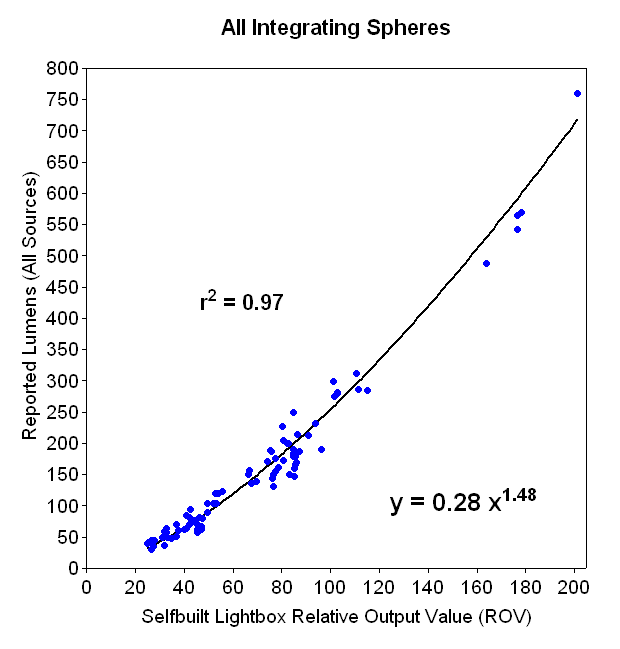

As you can see, these non-linear curves fit the data set very well. Correlation coefficients (r2) are reasonably good at 0.96 to 0.97. In fact, the fit is remarkably good considering we are talking about different light samples, run in 6 different ISs! oo:
oo:
As a result, I think you can be fairly confident in converting my lightbox relative output values (ROVs) into estimated lumens using the following formulas:
For lightbox readings < 20 ROV, estimated Lumens = 0.56 * ROV^1.30
For lightbox readings > 25 ROV, estimate Lumens = 0.28 * ROV^1.48
For values in-between 20 and 25 ROV, I recommend averaging the two methods.
If you would rather not bother, not to worry – I plan to report the estimated lumen values in the summary tables of my reviews from now on. I will be doing this according the ANSI FL-1 standards (i.e. report estimated lumens at 3 mins into the run).
For those of you who have trouble visualizing non-linear data, below are some direct plots of my transformed lumen estimates against the original 6 different IS sources. If the conversions have worked well, the result should be perfectly linear.
My lumen estimates thus seem to correlate to the reported IS measures pretty linearly, wouldn't you say?
Please note, there are a few caveats here. First off, I don't have a lot of comparison data at the high-output range (i.e. >300 lumens). Thus, lumen estimates at the high end should be regarded with some degree of skepticism. As more data becomes available, I may need to revise these power relationships.
Another key point – a milk carton is not really a good integrating sphere! Not surprisingly, I've noticed in my lightbox that really strong throwers with narrow spillbeams typically report with lower values than similarly driven lights with wider spillbeams. Frankly, I'm surprised my values correlate so well with so many other sources. This may suggest that all lightboxes (including ISs) have some difficulty in integrating dedicated thrower lights. My point is that all attempts to compare overall output in lights with widely different beam patterns needs to be considered carefully (i.e. there may be systematic biases in all measures).
But at the end of the day, I think the analysis and correlation results tell a pretty compelling story - especially since they consist of the multiple output levels of over 40 lights taken from 6 different sources. You can thus feel fairly confident in converting my lightbox readings to something approximating lumens.
-----
P.S. A pet peeve of mine is the difference between precision and accuracy. Technically speaking, accuracy refers to the degree of conformity of a measure to the actual, true value. Precision is simply the degree of refinement with which a measure can be taken or stated.
In this case, I know my lightbox is precise to 3-4 significant figures (i.e. I can reliably get a value to that stated precision, on repeated testing). Of course, that says nothing about how accurate the result is! My "feel" for the range of lumen estimates out there tells me that we really shouldn't be reporting anything more than 2 sig figs for the output measures. Beyond that, I rather doubt any given IS is really all that accurate to the "true" lumen output.
Of course, scientific notation doesn't work well for text, so what I'm going to do is round my ~100-200 lumen estimates to the nearest half point past 2 sig figs (e.g. 145, 210, 160, 175, etc.), and keep the >200 lumen estimates to just 2 sig figs (e.g. 340, 470, 1100, etc.). That's really as far as I feel comfortable pushing my results.
---------------
UPDATE May 18, 2012: As you may have noticed, this original set of lightbox-lumen conversion estimates was based on lights <800 lumens or so. You might wonder, how do more recent higher output lights compare?
One issue here is that most of these high-power lights are actually too big to fit into my lightbox. Many of them have large multi-emitter heads, or massive reflectors for more throw.
So I have had to find an alternative to sticking them in my lightbox. Since the original goal of a milk carton lightbox was to simulate a ceiling bounce measure in a small room/closet, that is exactly what I have gone back to for output measures in high-powered lights.
I have performed a comparable analysis of ceiling bounce-to-lumen correlations for a number of high output lights, in much the same way as I have done here for lightbox-to-lumen. The results have allowed me to fairly accurately provide estimated lumens for high output lights.
In fact, I am actually surprised at how well this conversion continues to be consistent for new lights with properly-tested lumen measures (i.e., my method continues to appear to be accurate, within a low margin of error).
To keep the presentation of results simple, I am starting to present graphs of these high-output lights directly in estimated lumens. But I can easily work back from these ceiling bounce-to-lumen conversions to estimated lightbox relative values. As you will notice in all my reviews, I have always done ceiling bounce measures of outputs for all my lights. This gives me a large database to correlate lightbox readings to my ceiling bounce setup. So, I can easily represent my high-output lights on the same relative lightbox output scale, by converting back from the lumen estimates. This is very convenient when wanting to compare the output/runtime performance to older lights.
As always, I continue to monitor and verify my conversion methods, as well as the calibration level of my equipement (i.e., relative to my initial arbitrary reference standard). So far, things continue to remain on track with periodic monitoring and adjustment. :wave:
But the real question is, can the relative output values of my home-made milk carton lightbox be converted to lumen estimates? First off, a few points about my lightbox.
I generally modeled my lightbox design on Quickbeam's (aka Doug Pribis) flashlightreviews.com site. Sadly, this excellent resource is no longer active (and the domain has been taken over by someone who has pirated Doug's original treasure-trove and added other unconfirmed and pirated material :shakehead). But at least the background info still seems to be there, untouched.
My lightbox differs in one important way - I've reversed the light and sensor placement, to facilitate runtimes. In my case, the flashlight enters the flat bottom of the milk carton, and the sensor is located on the side of the carton near the base. The bezel of the flashlight thus serves as its own baffle, preventing any light from shining directly on the sensor.
As Doug noted, this is hardly a perfect integrating sphere. But it doesn't have to be – as long as you realize the results are simply relative output values, you can still draw meaningful comparisons between lights. But can you convert my milk-carton output values to estimated lumens by some sort of conversion factor?
To begin to answer that question, you would need calibrated IS data for the lights tested in the lightbox. Well, if I had a calibrated IS, I would be using it.
Below is a graph showing how lights in my lightbox correlate to the reported IS values by three members here (MrGman, ti-force, and bigchelis) and three manufacturers (Fenix, 4Sevens and Novatac). Each data point represents one output mode of a given light we have in common. I have matched the reported batteries and time post-activation for the lights in question (if multiple time points were available, I picked the last one we both had in common). There are about 150 unique data points in the total set, representing over 40 lights.

If my lightbox were a calibrated IS, you would expect to see a perfect linear relationship as shown by the diagonal line. Obviously, it isn't.
But the relationship does look somewhat linear, just not 1:1. Is it? Let's improve the scale ranges and see:

Ok, clearly there is not a simple linear relationship of my lightbox to any of the IS results (although it isn't that far off, either). Still, this means that you cannot simply multiply my readings by a specific number to get a really good lumen estimate (i.e. the classic "y = mx + b" linear relationship with a slope and y-intercept wouldn't hold here).
But even though the relationship between my box and the reported IS values is not linear, it is most certainly not random. Rather, it is consistently curvilinear. In fact, to my eye, it looks like a simple power relationship (i.e. y = a * x^b).
Before the modern age of computers, it was certainly a complex problem to try and fit non-linear data. But nowadays, you can do all sorts of comparison modeling of non-linear systems with statistical validation.
I've spent some time running analyzes of this data set, and I can't quite get one good power relationship that fits the whole range of 0.1 to 800 lumens perfectly. However, I have found two power fits that work well – one for < 20 on my lightbox relative output scale, and one for > 25. Here is how they look:


As you can see, these non-linear curves fit the data set very well. Correlation coefficients (r2) are reasonably good at 0.96 to 0.97. In fact, the fit is remarkably good considering we are talking about different light samples, run in 6 different ISs!
As a result, I think you can be fairly confident in converting my lightbox relative output values (ROVs) into estimated lumens using the following formulas:
For lightbox readings < 20 ROV, estimated Lumens = 0.56 * ROV^1.30
For lightbox readings > 25 ROV, estimate Lumens = 0.28 * ROV^1.48
For values in-between 20 and 25 ROV, I recommend averaging the two methods.
If you would rather not bother, not to worry – I plan to report the estimated lumen values in the summary tables of my reviews from now on. I will be doing this according the ANSI FL-1 standards (i.e. report estimated lumens at 3 mins into the run).
For those of you who have trouble visualizing non-linear data, below are some direct plots of my transformed lumen estimates against the original 6 different IS sources. If the conversions have worked well, the result should be perfectly linear.


My lumen estimates thus seem to correlate to the reported IS measures pretty linearly, wouldn't you say?
Please note, there are a few caveats here. First off, I don't have a lot of comparison data at the high-output range (i.e. >300 lumens). Thus, lumen estimates at the high end should be regarded with some degree of skepticism. As more data becomes available, I may need to revise these power relationships.
Another key point – a milk carton is not really a good integrating sphere! Not surprisingly, I've noticed in my lightbox that really strong throwers with narrow spillbeams typically report with lower values than similarly driven lights with wider spillbeams. Frankly, I'm surprised my values correlate so well with so many other sources. This may suggest that all lightboxes (including ISs) have some difficulty in integrating dedicated thrower lights. My point is that all attempts to compare overall output in lights with widely different beam patterns needs to be considered carefully (i.e. there may be systematic biases in all measures).
But at the end of the day, I think the analysis and correlation results tell a pretty compelling story - especially since they consist of the multiple output levels of over 40 lights taken from 6 different sources. You can thus feel fairly confident in converting my lightbox readings to something approximating lumens.
-----
P.S. A pet peeve of mine is the difference between precision and accuracy. Technically speaking, accuracy refers to the degree of conformity of a measure to the actual, true value. Precision is simply the degree of refinement with which a measure can be taken or stated.
In this case, I know my lightbox is precise to 3-4 significant figures (i.e. I can reliably get a value to that stated precision, on repeated testing). Of course, that says nothing about how accurate the result is! My "feel" for the range of lumen estimates out there tells me that we really shouldn't be reporting anything more than 2 sig figs for the output measures. Beyond that, I rather doubt any given IS is really all that accurate to the "true" lumen output.
Of course, scientific notation doesn't work well for text, so what I'm going to do is round my ~100-200 lumen estimates to the nearest half point past 2 sig figs (e.g. 145, 210, 160, 175, etc.), and keep the >200 lumen estimates to just 2 sig figs (e.g. 340, 470, 1100, etc.). That's really as far as I feel comfortable pushing my results.
---------------
UPDATE May 18, 2012: As you may have noticed, this original set of lightbox-lumen conversion estimates was based on lights <800 lumens or so. You might wonder, how do more recent higher output lights compare?
One issue here is that most of these high-power lights are actually too big to fit into my lightbox.
So I have had to find an alternative to sticking them in my lightbox. Since the original goal of a milk carton lightbox was to simulate a ceiling bounce measure in a small room/closet, that is exactly what I have gone back to for output measures in high-powered lights.
I have performed a comparable analysis of ceiling bounce-to-lumen correlations for a number of high output lights, in much the same way as I have done here for lightbox-to-lumen. The results have allowed me to fairly accurately provide estimated lumens for high output lights.
In fact, I am actually surprised at how well this conversion continues to be consistent for new lights with properly-tested lumen measures (i.e., my method continues to appear to be accurate, within a low margin of error).
To keep the presentation of results simple, I am starting to present graphs of these high-output lights directly in estimated lumens. But I can easily work back from these ceiling bounce-to-lumen conversions to estimated lightbox relative values. As you will notice in all my reviews, I have always done ceiling bounce measures of outputs for all my lights. This gives me a large database to correlate lightbox readings to my ceiling bounce setup. So, I can easily represent my high-output lights on the same relative lightbox output scale, by converting back from the lumen estimates. This is very convenient when wanting to compare the output/runtime performance to older lights.
As always, I continue to monitor and verify my conversion methods, as well as the calibration level of my equipement (i.e., relative to my initial arbitrary reference standard). So far, things continue to remain on track with periodic monitoring and adjustment. :wave:
Last edited:
